Tokens per Second: How to Benchmark a Local LLM
A repeatable way to measure local LLM speed that separates prompt processing from generation, controls for caching and load, and shows how to question published tokens per second figures.
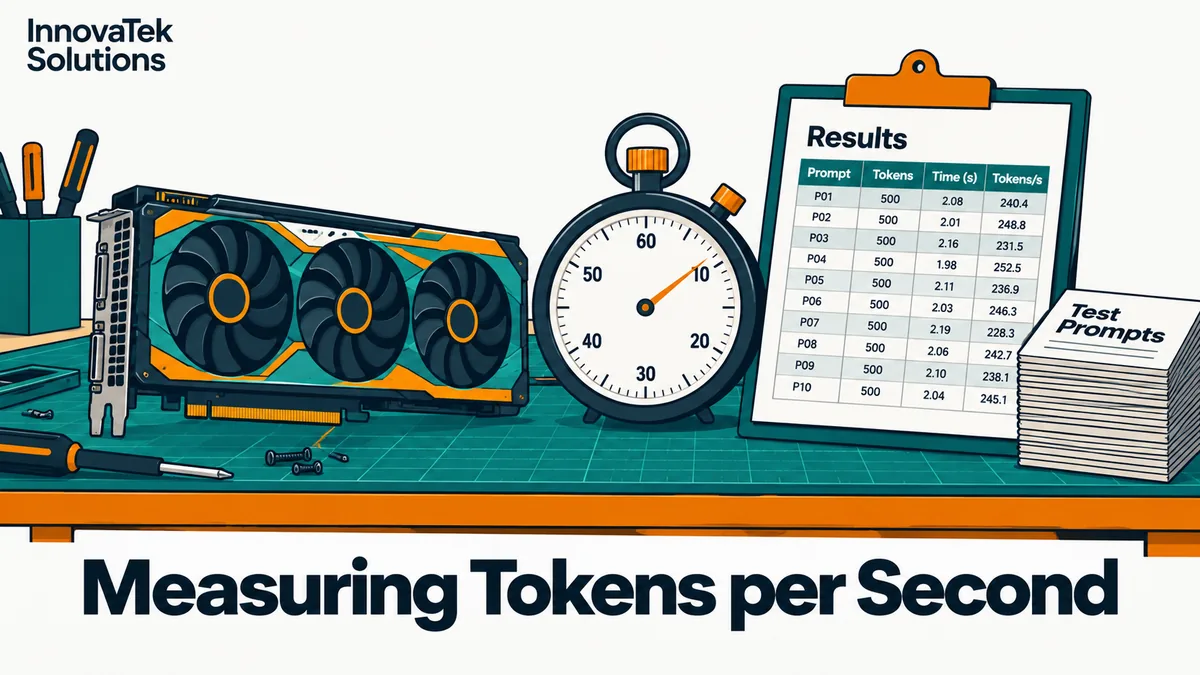
A single LLM tokens per second benchmark figure hides two different speeds. Take a document question with a 3,000-token prompt and a 300-token answer. If the machine reads prompts at 1,500 tokens per second and writes answers at 30 tokens per second, the user waits 3,000 / 1,500 = 2 seconds for the first word, then 300 / 30 = 10 seconds for the rest, 12 seconds in total. Report that run as "25 tokens per second" (300 output tokens over 12 seconds) or as "275 tokens per second" (3,300 tokens of all kinds over 12 seconds) and both are arithmetically true. A useful benchmark keeps the two speeds apart and fixes everything else.
The four numbers worth recording
Every request to a local model has two phases. In prompt processing (also called prefill or prompt eval), the runtime reads all input tokens at once; this phase leans on raw compute and runs at hundreds or thousands of tokens per second on a GPU. In generation (decode or eval), the model produces one token at a time, and each step reads the model's weights from memory, so speed tracks memory bandwidth and is far lower. Why those two limits differ by hardware is covered in the guide on choosing a GPU for a local LLM.
From those phases come four measurements:
| Measurement | Formula | What it predicts |
|---|---|---|
| Prompt processing speed | prompt tokens / prompt time | How long documents feel |
| Generation speed | output tokens / generation time | How fast text streams once it starts |
| Time to first token (TTFT) | queue wait + load time + prompt time + first step | How long the reply box stays empty |
| End-to-end latency | TTFT + remaining output / generation speed | Total wait for a full answer |
Record all four, plus the prompt and output lengths they came from. A generation speed without its context length is half a fact, because generation slows as the context fills: every new token attends to every token before it.
Fix everything except the thing being tested
A benchmark compares one change at a time: card A against card B, 4-bit against 8-bit, runtime X against runtime Y. Everything else must stay put, and written down:
- Model file. Exact file name and checksum, rather than "Llama 8B". Two downloads with the same name can differ in quantization, and the quantization level alone can move generation speed substantially.
- Runtime and version. The build number or release tag. Speed changes between releases.
- Settings. Context size, GPU layers offloaded, batch size, flash attention, KV cache type. A runtime that silently put some layers on the CPU looks like a slow GPU.
- Prompts. A fixed set, saved as files.
- Output length. Force it. If one run stops after 40 tokens and another writes 600, their speeds are not comparable. llama.cpp's server accepts
n_predictfor a maximum andignore_eosto keep generating past the natural stop, and vLLM's benchmark client has an--ignore-eosflag for the same purpose. - Sampling. Temperature 0 or a fixed seed, so the same work happens each time.
- Machine state. No other jobs on the GPU, power profile noted, and the card at its normal operating temperature.
Build the prompt set from real traffic
Pull a dozen representative prompts from a pilot or from the job the server is for, and sort them into length buckets, for example short (under 200 tokens), medium (around 2,000) and long (8,000 or more, if staff will paste whole documents). Run each bucket separately and report each separately.
Cold, warm and cached runs
The first request after a model loads includes reading gigabytes of weights from disk into memory. Ollama reports this separately as load_duration, and per its FAQ keeps a model loaded for 5 minutes by default before unloading it (adjustable with OLLAMA_KEEP_ALIVE or a per-request keep_alive). So a benchmark that pauses for six minutes between runs is measuring disk speed as much as the GPU.
Decide which question is being asked:
- Cold start: how long does the first user of the morning wait? Measure it on purpose, after unloading the model, and report it on its own line.
- Warm steady state: how fast is the server during the day? Load the model first, send one throwaway request, then measure.
The opposite trap is caching. llama.cpp's server reuses the KV cache from a previous request by default (cache_prompt is true), and reports the reused tokens as cache_n next to prompt_n. Ollama's prompt_eval_duration is documented as the time spent on the uncached prompt tokens, and newer responses add prompt_eval_cached_count for the tokens read from cache. Send the identical long prompt five times and runs two to five may skip most of the prefill, producing a prompt speed nobody will see with fresh documents. Either vary the prompts between repetitions, turn prompt caching off for the test, or check that the cached-token count is zero before trusting the number. Measure caching as its own labeled result, since chat with a long system prompt does benefit from it.
Repeat, then use the median
Run each test at least five times and report the median with the spread. Suppose five warm generation runs give 29.8, 30.1, 30.4, 30.0 and 22.5 tokens per second. The mean is 142.8 / 5 = 28.6; the median is 30.0. The outlier is a signal to find (a background job, a throttling card), not a number to average away. For hardware that will run all day, add one sustained run of ten minutes or more, because a card that is fast for 30 seconds and then hits its thermal limit will benchmark well and serve badly.
Tools that report the split for you
llama-bench
llama.cpp ships llama-bench, which measures the two phases separately. Its defaults, per the llama-bench README, are a 512-token prompt test (-p 512, reported as pp512) and a 128-token generation test (-n 128, reported as tg128), each repeated 5 times (-r 5) after a warmup, with results given as average tokens per second and standard deviation. The -d flag prefills the KV cache to a given depth first, which answers the question that matters for document work: how fast is generation once the context is already full?
llama-bench -m model-Q4_K_M.gguf -ngl 99 -p 512,4096 -n 128 -d 0,8192 -r 5 -o csv
That command reports both speeds at empty context and at 8,192 tokens of depth, as CSV. Because it bypasses the HTTP server, it measures the engine; it does not include network or queueing time.
Ollama's timing fields
Every Ollama API response carries prompt_eval_count, prompt_eval_duration, eval_count, eval_duration, load_duration and total_duration, with all durations in nanoseconds, per the Ollama usage docs. ollama run --verbose prints the same figures after each answer. Converting is plain division. An illustrative response:
prompt_eval_count2,950 andprompt_eval_duration1,840,000,000: 2,950 / 1.84 s = 1,603 tokens per second for prompt processingeval_count412 andeval_duration13,700,000,000: 412 / 13.7 s = 30.1 tokens per second for generationload_duration6,200,000,000: a 6.2-second cold load, which belongs in the cold-start line, not in the speed figures
llama.cpp server timings
llama-server returns a timings object with prompt_n, prompt_per_second, predicted_n, predicted_per_second and cache_n. Logging these from real requests turns a one-off benchmark into a baseline for monitoring the server later.
Under concurrent load the numbers change
Everything above describes one request at a time. With several users, batching raises total output while each user's speed and TTFT get worse, so a single-user figure says little about a shared server. A load test needs a client that sends requests in parallel and times them from the outside, such as vLLM's vllm bench serve. Its time per output token (TPOT) is computed per request as end-to-end latency minus TTFT, divided by output tokens minus one, per the vLLM benchmark docs; that keeps the prefill wait out of the generation figure, the same split as the single-user test. Report per-user speed and aggregate throughput as two separate columns, with the concurrency level beside them and TTFT as a high percentile rather than an average. Turning that curve into a staff headcount is a capacity question, worked through in how many users one GPU can serve.
Reading someone else's benchmark with suspicion
Published tokens per second figures rarely agree. Before using any published figure, check whether it answers these questions:
- Which phase? A four-digit number is almost always prompt processing; a two-digit one is usually generation. A post that does not say which is not usable.
- Per user or aggregate? A batched server producing 1,000 tokens per second across 32 requests is giving each user about 31.
- What quantization and file? A 4-bit model against an 8-bit one on the same card is a comparison of quantizations, not hardware.
- What context depth? Generation at an empty context flatters every machine. Ask for a number at a depth close to the real prompts.
- How long was the output? Ten tokens hides startup overhead and thermal limits; it says nothing about a 600-token draft.
- Warm, cold or cached? A repeated prompt with caching on can show a prompt speed many times the real one.
- What runtime version and settings? Without them, the result cannot be repeated.
- Is there a spread? One run with no variance is a single sample.
A figure that fails several of these is a rough order of magnitude at most; the decision should rest on a test with the exact model file and prompts the business will run.
Frequently asked questions
What tokens per second feels fast enough for a person reading along?
Comfortable reading speed is well below most GPU generation rates, so for streamed chat the bigger complaint is usually the wait before the first word. Set targets for both: a maximum TTFT for typical prompt lengths and a minimum generation speed.
Do tokens per second figures compare across different models?
Only loosely. Models use different tokenizers, so the same paragraph can be a different number of tokens in each. For comparing models, words or characters per second on the same prompt set, or simply seconds to a complete answer, is the fairer unit.
Does the benchmark have to run on the production machine itself?
Ideally on that machine, or one with the same GPU, driver, runtime build and power limit. Results do not scale neatly from one card class to another, because prefill and generation hit different limits. If the first test used a loaner, rerun the warm tests on the delivered server and keep those as the baseline.
Ready to Modernize Your Business?
Get your AI automation roadmap in minutes, not months.
Analyze Your Workflows →